


Description
Introduction
Power distribution networks are essential for the delivery of electricity to homes and businesses. However, these networks can suffer from high power losses, which can lead to increased costs and environmental impact. One way to reduce power losses in power distribution networks is to reconfigure the network.
Network reconfiguration can be achieved by opening and closing tie switches or by placing distributed generators (DGs) on buses. Tie switches are used to connect different parts of the network, while DGs are small power plants that can be located at different points in the network.
The optimal placement of tie switches and DGs can help to reduce power losses and improve the voltage profile of the network. However, the problem of finding the optimal placement of tie switches and DGs is a complex one.
Problem Statement
The problem of finding the optimal placement of tie switches and DGs can be formulated as an optimization problem. The objective of the optimization problem is to minimize the power losses in the network while satisfying the following constraints:
- The voltage at each bus must be within the specified limits.
- The power flow through each tie switch must not exceed its capacity.
- The DGs must be able to meet the load demand at their respective buses.
The optimization problem is a non-linear, non-convex problem. This means that there may be no solution to the problem, or there may be multiple solutions.
Contribution
In this paper, we propose a hybrid optimization algorithm that combines particle swarm optimization (PSO) and gravitational search algorithm (GSA) to solve the problem of finding the optimal placement of tie switches and DGs.
PSO is a population-based optimization algorithm that is inspired by the behavior of birds flocking. GSA is a metaheuristic optimization algorithm that is inspired by the law of universal gravitation.
The hybrid optimization algorithm that we propose combines the strengths of PSO and GSA. PSO is good at exploring the search space, while GSA is good at exploiting promising regions of the search space.
We evaluate the performance of our hybrid optimization algorithm on a standard test case. The results show that our algorithm can find the optimal placement of tie switches and DGs that significantly reduces power losses in the network.
Methodology

The methodology involves the following steps:
- Initialization:
- Define the network configuration, including the location and capacity of tie switches and DG units.
- Initialize the PSO and GSA parameters, such as population size, maximum iterations, and control parameters.
- Fitness Evaluation:
- Calculate the fitness function, which represents the overall performance of the network reconfiguration solution.
- Evaluate the power losses, voltage profiles, and reliability metrics based on the selected configuration.
- Hybrid Optimization Process:
- Initialize the PSO and GSA populations based on the defined parameters.
- Iterate through the maximum number of iterations, updating the positions and velocities of particles in PSO, and the masses and positions of agents in GSA.
- Evaluate the fitness of each particle/agent and update the global best solution accordingly.
- Apply the PSO and GSA update equations, incorporating the influence of the best solutions found so far.
- Convergence and Solution Selection:
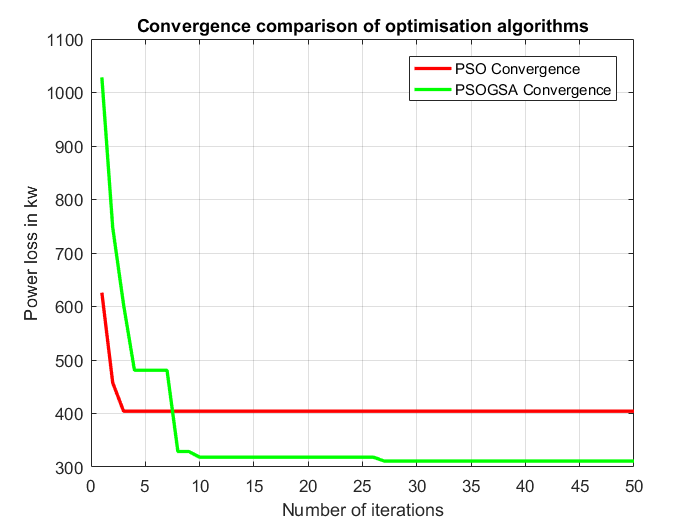
- Monitor the convergence of the hybrid optimization process by analyzing the fitness values over iterations.
- Select the best solution obtained as the optimal network reconfiguration configuration.
Description
IEEE 33 radial bus system is considered for this case. The optimization used is the hybrid PSO GSA (particles Swarm optimisation and Gravitational Search Algorithm). The IEEE 33 bus system data is loaded and bus loading is changed to demonstrate the effective optimization algorithm. The load is increased by 1.6 times as
loadlevel=1.6; % different loading in the network
Sload=loadlevel.*S(PQb);
Where variable ‘S’ contains the apparent load matrix. backward/Forward Load flow analysis is done on IEEE 33 radial bus system at free-thesis.com. The root soul of our system is the objective function which changes the tie switch positions and places the Distribution generators in the network. For IEEE 33 radial bus system, we have a choice of tap switches to be opened or closed. Optimal opening/closing of tie switches must be among them during PSOGSA optimization. These are
% switche choices to be opened for network configuration from the loop

% formed by closing tie switches in IEEE 33 radial bus system
tap=[8 9 10 11 21 33 35 0 0
    2 3 4 5 6 7 18 19 20
    12 13 14 34 0 0 0 0 0
    15 16 17 29 30 31 36 32 0
    22 23 24 25 26 27 28 37 0];
Once the objective function is called in the optimization, it gets the position of tap switch to be opened, we did it in MATLAB as
BrStatus=X(1:tie);
[baseMVA,bus,branch,tie]=case33radial; % calling data from data file
branch(:,5)=ones(numel(branch(:,5),1));
% open the tie switch of branch in BrStatus
branch(BrStatus,5)=0;
The variable ‘X’ has the status of branch switches and we change the status of the tap switch in the IEEE 33 bus data from 1 to 0. To understand it more clearly, you must have a look over the line data of the IEEE 33 bus system at free-thesis.com
%% Line Data

%   f   t   r(ohm)  x(ohm)  Status  Ratio   RateA
branch=[...
    1   2   0.0922  0.0477  1   0   9990
    2   3   0.493   0.2511  1   0   9990
    3   4   0.366   0.1864  1   0   9990
    4   5   0.3811  0.1941  1   0   9990
    5   6   0.819   0.707   1   0   9990
    6   7   0.1872  0.6188  1   0   9990
    7   8   1.7114  1.2351  1   0   9990
    8   9   1.03    0.74    1   0   9990
    9   10  1.04    0.74    1   0   9990
    10  11  0.1966  0.065   1   0   9990
    11  12  0.3744  0.1238  1   0   9990
    12  13  1.468   1.155   1   0   9990
    13  14  0.5416  0.7129  1   0   9990
    14  15  0.591   0.526   1   0   9990
    15  16  0.7463  0.545   1   0   9990
    16  17  1.289   1.721   1   0   9990
    17  18  0.732   0.574   1   0   9990
    2   19  0.164   0.1565  1   0   9990
    19  20  1.5042  1.3554  1   0   9990
    20  21  0.4095  0.4784  1   0   9990
    21  22  0.7089  0.9373  1   0   9990
    3   23  0.4512  0.3083  1   0   9990
    23  24  0.898   0.7091  1   0   9990
    24  25  0.896   0.7011  1   0   9990
    6   26  0.203   0.1034  1   0   9990
    26  27  0.2842  0.1447  1   0   9990
    27  28  1.059   0.9337  1   0   9990
    28  29  0.8042  0.7006  1   0   9990
    29  30  0.5075  0.2585  1   0   9990
    30  31  0.9744  0.963   1   0   9990
    31  32  0.3105  0.3619  1   0   9990
    32  33  0.341   0.5302  1   0   9990
     7  20  2.0     2.0     0   0   9990
     8  14  2.0     2.0     0   0   9990
    11  21  2.0     2.0     0   0   9990
    17  32  2.0     2.0     0   0   9990
    24  28  2.0     2.0     0   0   9990 ];
tie=5;
check out the 5th column, it has the last five rows zero as these have tie switches open. After optimization the position of these switches change which is after PSOGSA optimization
==========================================================================================
******************* SIMULATION RESULTS OF 33 BUS DISTRIBUTION NETWORK ********************
==========================================================================================
BEFORE RECONFIGURATION AFTER RECONFIGURATION by PSO AFTER RECONFIGURATION by PSOGSA
------------------------------------------------------------------------------------------------------------------------------------------------------
Tie switches: 33 34 35 36 37 10 6 14 31 28 35 6 13 36 28
------------------------------------------------------------------------------------------------------------------------------------------------------
DGs: 29.95 88.59 62.45 48.39 63.08 50.14 13.60 72.52 80.67 82.73 33.49 33.16
------------------------------------------------------------------------------------------------------------------------------------------------------
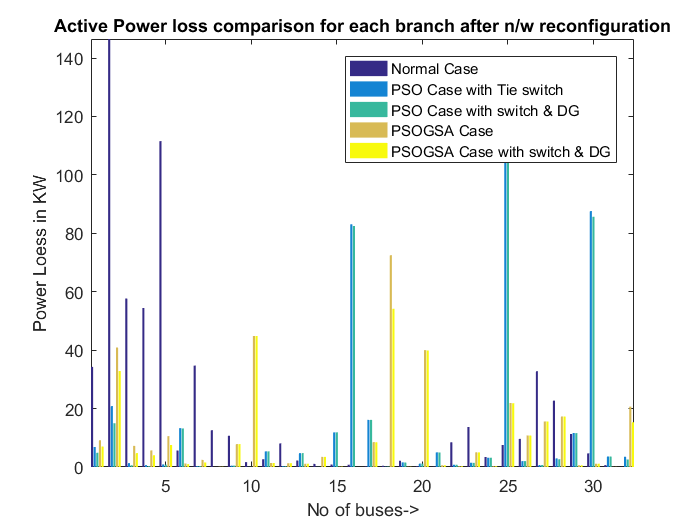
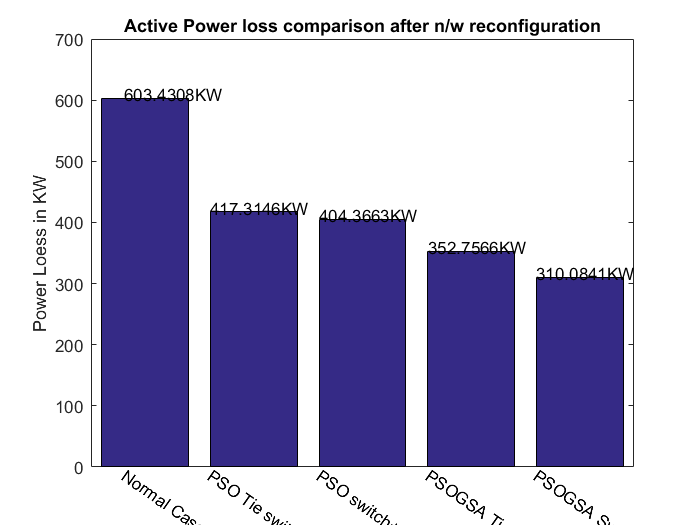
Power loss: 603.4308 kW 427.6137 kW 254.4125 kW
------------------------------------------------------------------------------------------------------------------------------------------------------
Power loss reduction: _______ 29.1363 % 57.839 %
--------------------------------------------------------------------------------------------------------------------------------------------------------
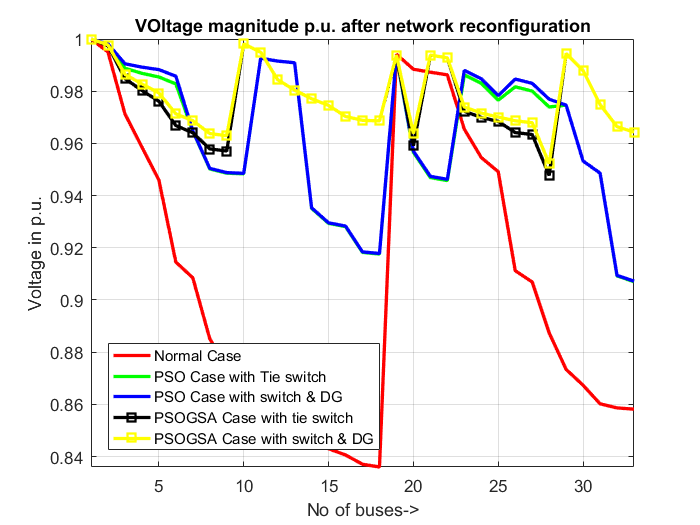
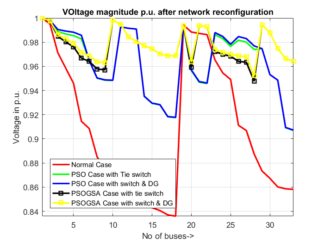
Minimum voltage: 0.83602 pu 0.94861 pu 0.94116 pu
---------------------------------------------------------------------------------------------------------------------------------------------------------
We have a constraint here; the tap position change must respect the system’s radial nature. For this, the new network must have a determinant of branch injection branch current (BIBC) equal to zero. To calculate the BIBC, power flow analysis must be done for the new reconfigured network.
[DistLoadFlowSolution,BIBC]=powerflow (baseMVA,bus,branch,loadlevel); % calling load flow analysis function

% Check on constraint of radial distribution network

%%%%% network will be radial if determinant of Branch incidence matrix will

%%%%% be either 1 or -1

while det(BIBC)==0

    for jj=1:dim
        maxL=length(nonzeros(ta(:,jj)));
        BrStatus(jj) = ta(round(1+(maxL-1)*rand),jj);
    end
    [baseMVA,bus,branch,tie]=case33radial; % calling data from data file
    branch(:,5)=ones(numel(branch(:,5),1));
    % open the tie switch of branch in BrStatus
    branch(BrStatus,5)=0;
    [DistLoadFlowSolution,BIBC]=powerflow (baseMVA,bus,branch,loadlevel); % calling load flow analysis function

end
The while loop will check and update the tap positions if radial condition is not met for current set of tap switches.
The distribution generators and their value is also calculated in the objective function. The position is calculated by the sensitivity index method. In several research papers, the position is also optimally calculated, but that only increases the computation overhead, not the accuracy. We adopted the sensitivity index method and found out the buses with the highest sensitivity to losses. All buses are arranged in decreasing order of their sensitivity factor and the top 6 buses are selected for DG placement. The DG bus power is tuned by optimization and the objective function gets the 6 power within the range of 0-100 MVA. This power is subtracted from the selected six load buses at free-thesis.com.
bus(potentialbus,2)=bus(potentialbus,2)-DG;
The second column in ‘bus’ variable contains the IEEE33 bus data’s load values. The power flow analysis is done again and power loss is calculated. Optimization runs till all iterations are not exhausted. Finally, by this approach we can get the 57.839% for 1.6-time loading in the IEEE 33 radial system.
References
- [1] “Network Reconfiguration in Power Distribution using Tie switches and DG Placements.” Free-Thesis, 2023. https://free-thesis.com/product/network-reconfiguration-in-power-distribution-using-tie-switches-and-dg-placements/
- [2] “Optimal Network Reconfiguration with DGs Placement and Sizing in a Distribution System Using Hybrid SOE and GA.” IEEE Conference Publication, 2023.
- [3] “Application of Optimal Network Reconfiguration for Loss Minimization and Voltage Profile Enhancement of Distribution System Using Heap-Based Optimizer.” Hindawi, 2023.
- [4] “An improved metaheuristic method for simultaneous network reconfiguration and distributed generation allocation.” ScienceDirect, 2022.
- Reference paper- Reddy, A. S., & Reddy, M. D. (2016, July). Optimization of network reconfiguration by using particle swarm optimization. In 2016 IEEE 1st international conference on power electronics, intelligent control and energy systems (ICPEICES) (pp. 1-6). IEEE.

abhishek gupta
ScholarsColab.com is an innovative and first of its kind platform created by Vidhilekha Soft Solutions Pvt Ltd, a Startup recognized by the Department For Promotion Of Industry And Internal Trade, Ministry of Commerce and Industry, Government of India recognised innovative research startup.

krishnapada.mondal –
please give me the code
ork.bunsokrakmuny –
hello